
“We are working with ‘open water’ in the northern upland chain LNP – mostly ponds etc, but sometimes larger lakes. Ponds (and water) is a good one, we thought, because it is easy to target new habitat through working with farmers and the stewardship schemes. We are really pleased with Condatis.” A. Mansley, Northumberland National Park Authority
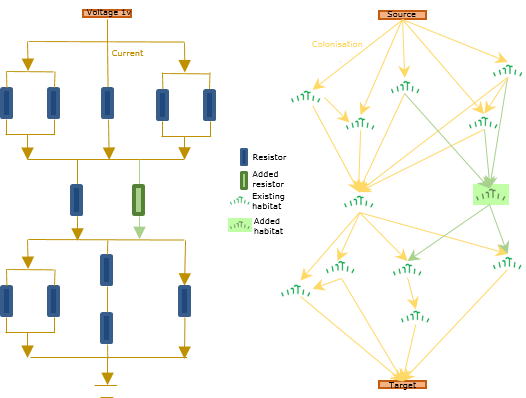
Electrical circuit on the left and comparable stylised habitat map on the right. Green represents adding a resistor or additional habitat to each to increase the number of pathways available and therefore improve the flow.
Condatis models a landscape of habitats as if it were an electrical circuit. A circuit board consists of a number of wires joining up resistors in combinations. When a voltage is applied to the board at one end, the current will pass through the board to the other end but the amount of current passing through each wire will vary according to the resistances it meets through each pathway. Condatis considers a landscape as analogous to a circuit board, with a source population of species being considered the voltage, the links between habitat useable by these species being the resistors, and the flow of species colonising the available habitat across those links being considered the current.
The webapp help is now the best place to go if you read this page and want to give Condatis a try.
A full description of the underlying scientific method can be found in the following papers 2016 2012
Habitat
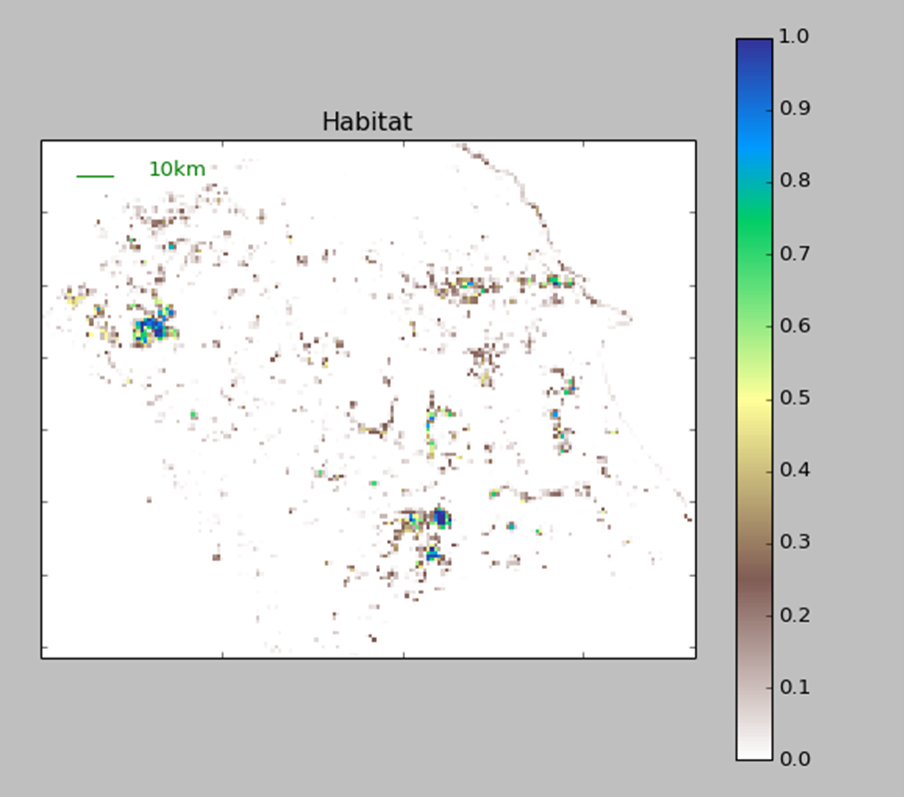
Imported map showing grassland habitat at 1km resolution, scaled to show proportion of grassland within each 1km square
Using Condatis begins by opening a habitat map on which the conservation scenario will be based. The map can be produced from most GIS software: simply create a raster containing the habitat in the area of interest which is appropriate to the species under consideration. The example shows the proportion of grassland habitat present per 1km square. Condatis can import geotiff or ESRI files.
Next, source and target locations are specified: the source either representing a nominal population of species or an actual population, the target representing an area for eventual colonisation. These can be selected using preset North South East West edges or bespoke sources and targets can be defined by a raster map. The direction of travel is defined by the placement of source and target and will depend on the purpose of study. For instance, if looking at likely species movement due to climate change, a south to north or lowland to upland direction might be required. Condatis looks at how the habitat in between the source and target could contribute to the species progress over multiple generations, so it is not designed to look in detail at individual patch-to-patch movements.
 Flow
Flow

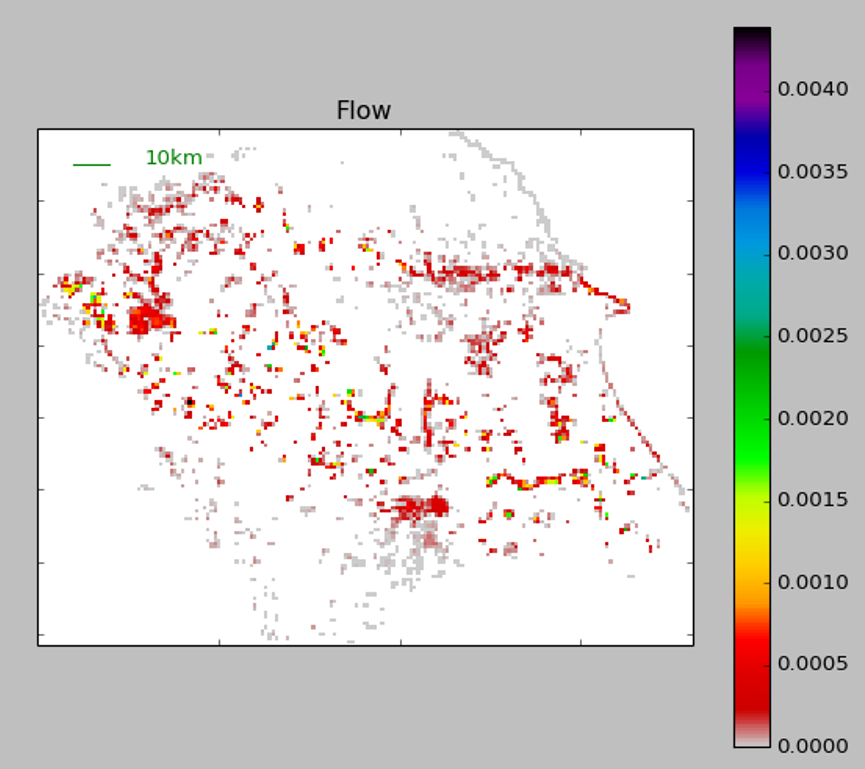
Flow of colonisation across the landscape from east to west, scale shows amount of flow through each habitat cell
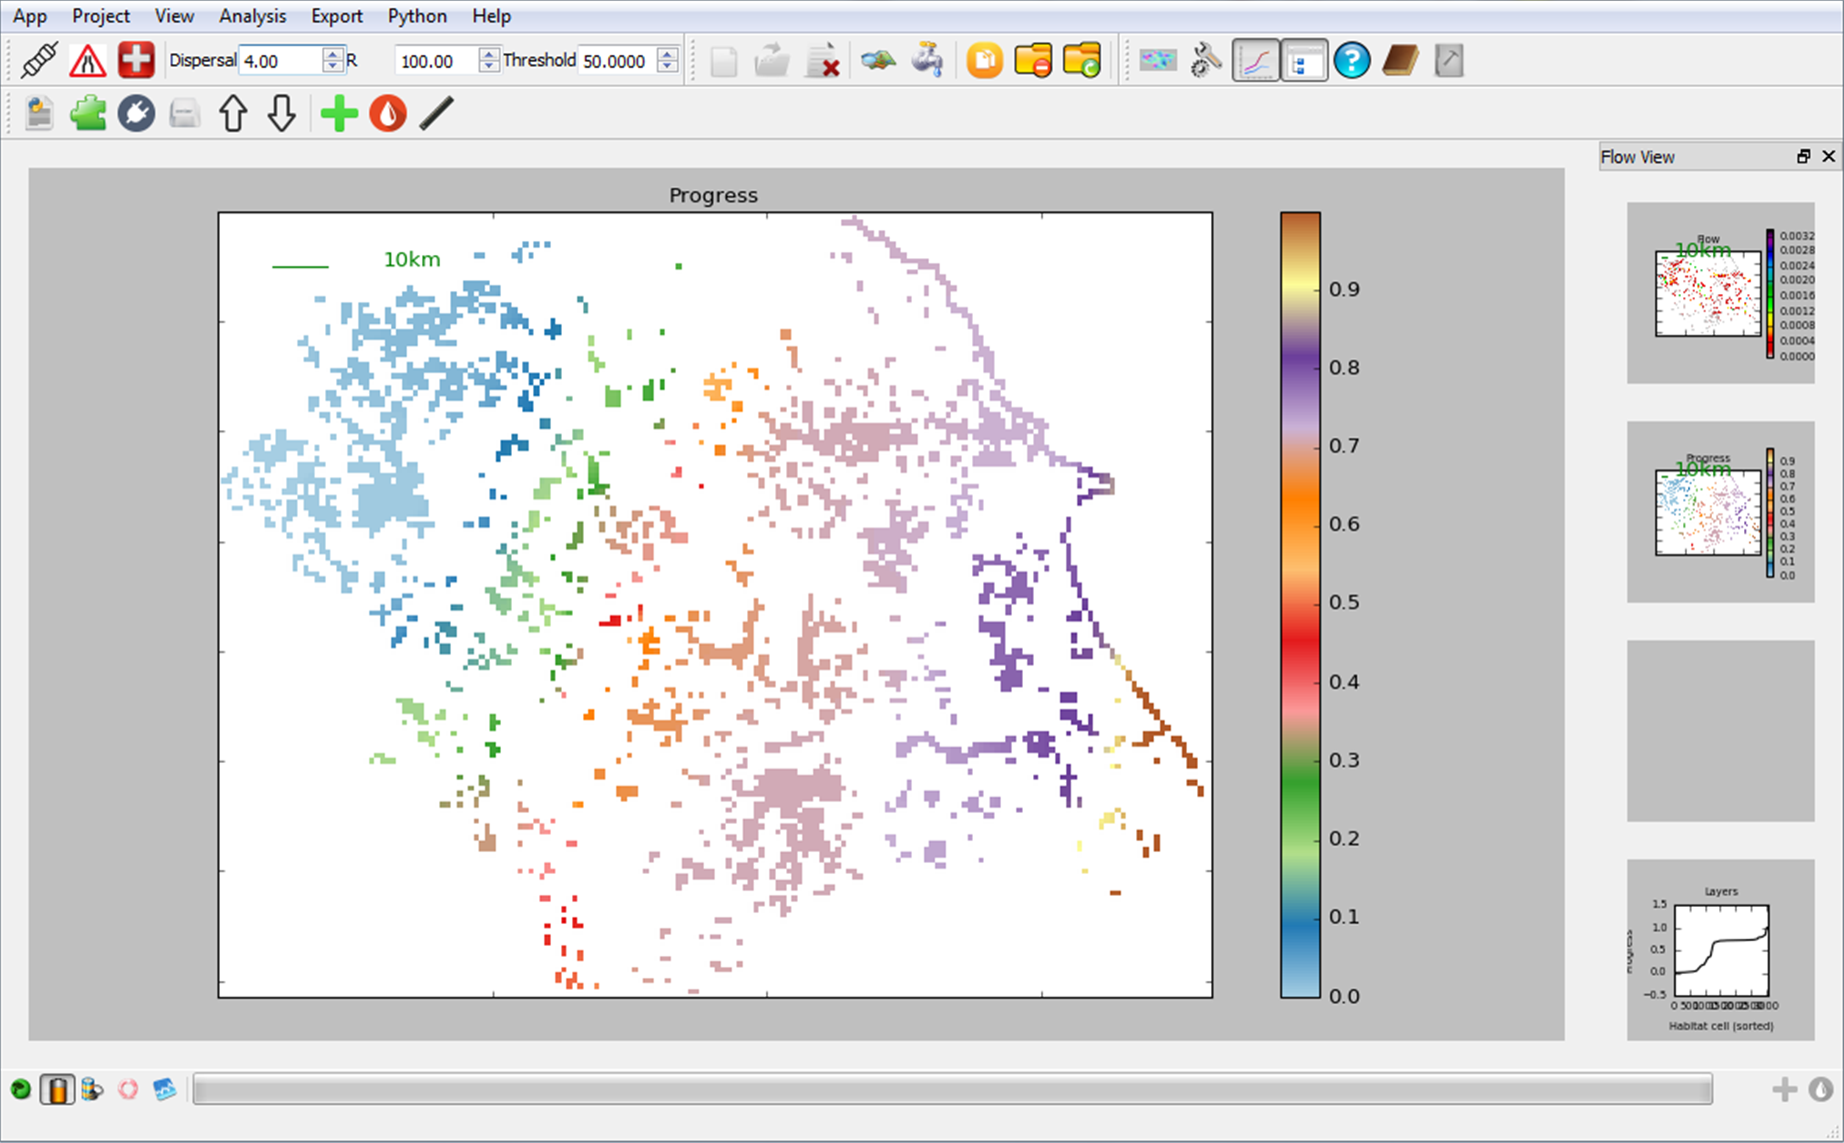
Flow output showing progress of colonisation from east to west. Broad colour bands represent steady colonisation over that area, narrow bands show slow or discontinuous progress
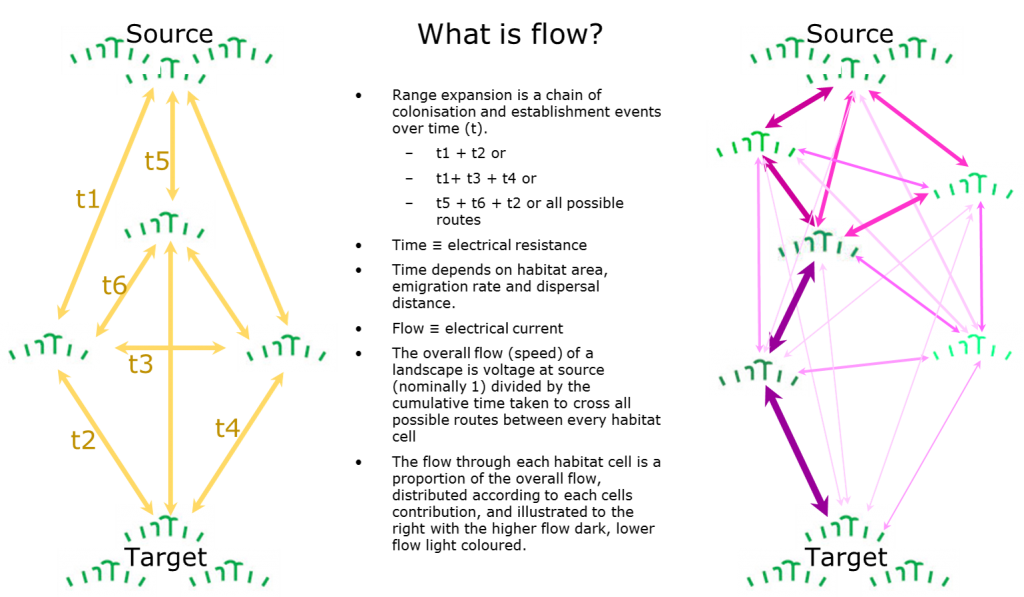
Each habitat cell is assumed to be linked with every other habitat cell; the strength of each of these links is dependent on the time it would take for the population of one cell to send colonists to populate the other cell. The time taken is considered analogous to resistance in the Condatis model. By selecting a dispersal distance (the average dispersal distance per generation) and the reproductive rate of a species (either known or representative), Condatis will calculate the overall flow from source to target and the portion of this flow travelling through each individual habitat cell. This is plotted on a map, colour coded to highlight the areas of most concentrated flow. Condatis also calculates the overall speed which is a measure of how quickly the target can be reached from the source via any route, and can be used as a directly comparable landscape connectivity metric across different scenarios and habitats.
Bottlenecks
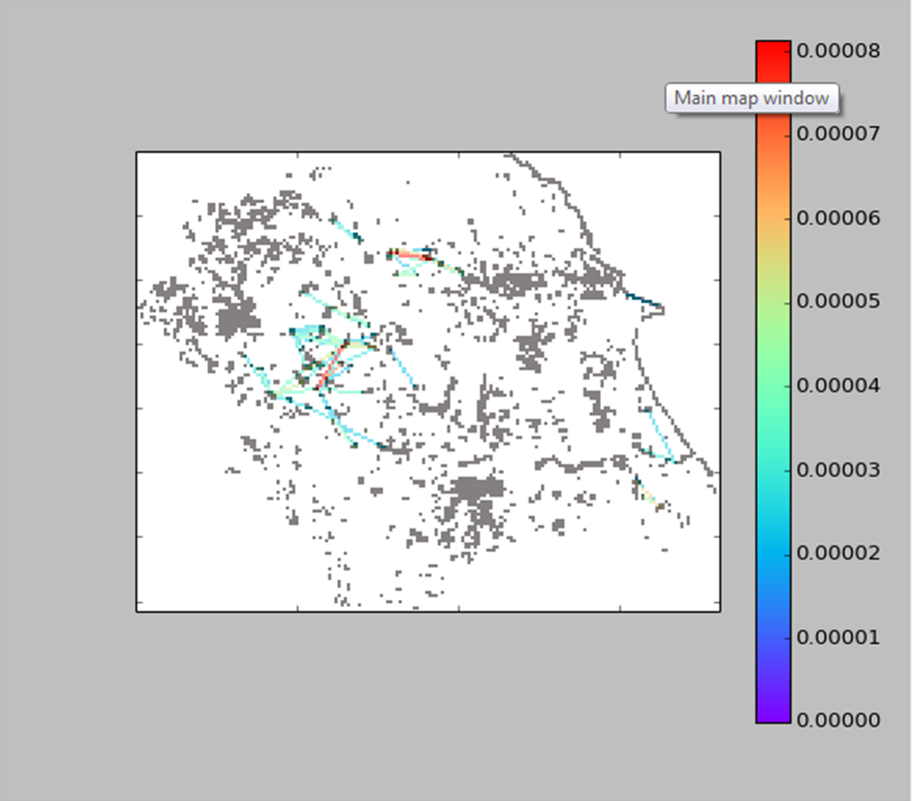
Bottleneck view showing the links between habitat cells under the highest strain – links where the highest flows of colonists have to jump the furthest distances to progress across the landscape
Condatis measures the amount of flow through each cell and the distance travelled across its links to other habitat cells. It uses this to calculate the power of each cell link, which we like to think of as the strain that each link is under. By ranking these it can produce a map showing these links of highest strain, which are “bottlenecks” in the landscape where a high proportion of the species flow is travelling through relatively few links.
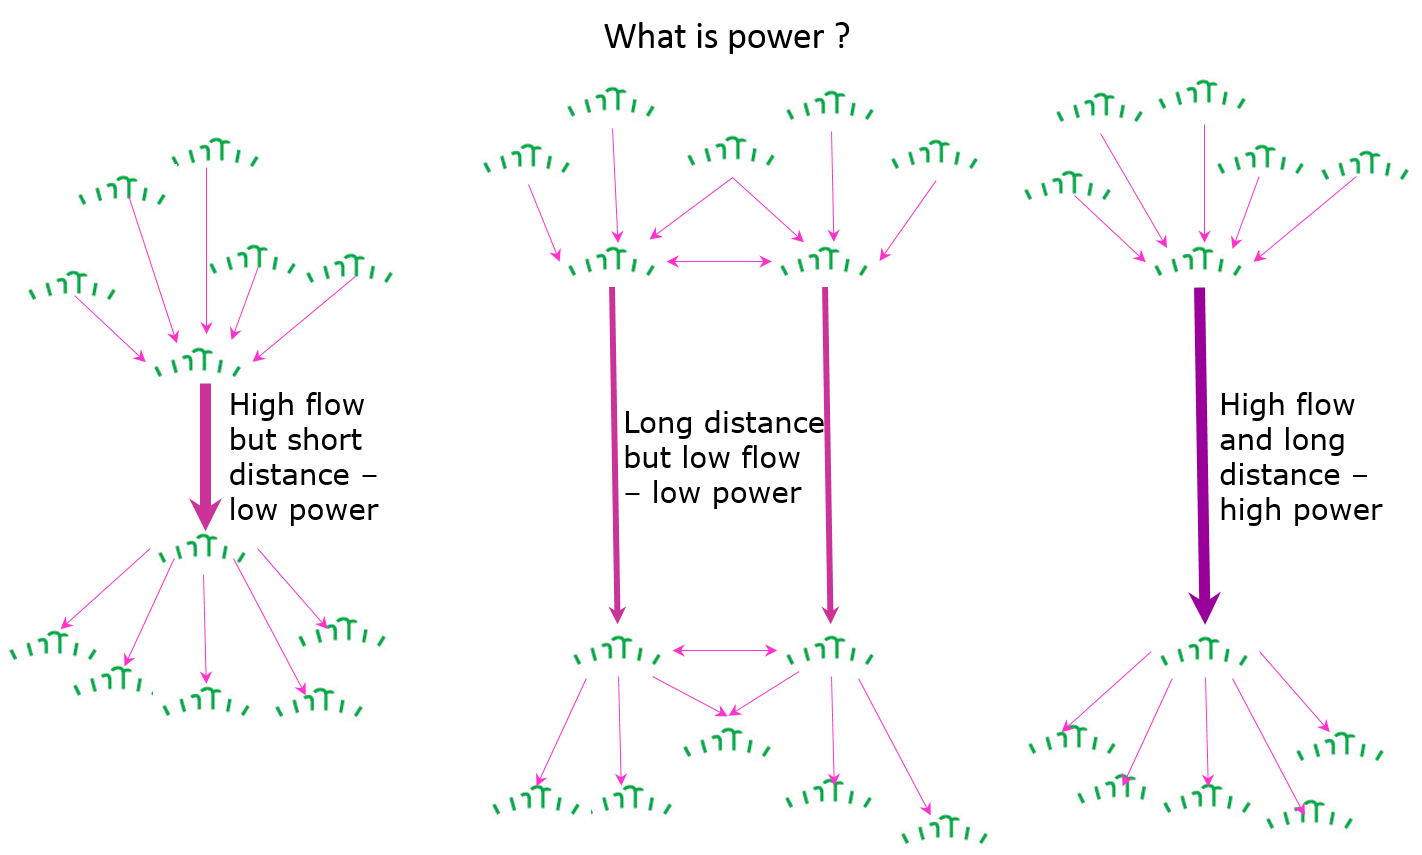 Often, a small number of links carry a disproportionately high amount of power. If habitat could be created around the bottlenecks it would disproportionately increase range-shifting connectivity.
Where to create habitat?
![Results of prioritisation overlaid onto ordnance survey map. The cells of potential habitat creation are ranked with those in darker pink offering greater contributions to habitat connectivity. Contains O.S. data @ Crown copyright [and database right] (2016)](http://wordpress.condatis.org.uk/wp-content/uploads/Backdrop-on-map2.png)
Results of dropping overlaid onto ordnance survey map. The cells of potential habitat creation are ranked with those darker shaded offering greater contributions to habitat connectivity. Contains O.S. data @ Crown copyright [and database right] (2016)
Prioritisation, aka Dropping, is a method for ranking patches of habitat for restoration or protection, when the user has a restricted map of feasible areas. The method shows how additional habitat cells can increase the speed of species’ movement across a landscape of existing habitat and can also be used to highlight areas of an existing network that cannot afford to be lost due their contribution to connectivity. In a prioritisation analysis, habitat cells are ranked according to their contribution to the speed of species’ movement and the lowest-ranking additional cells are ‘dropped’ from the landscape. This procedure is repeated multiple times until only the most important cells remain, contributing the most to flow.
The webapp help contains more explanation of how to perform and interpret a prioritisation analysis.
 Is this the right software for me?
Condatis is a highly flexible and very powerful tool designed for landscape scale studies of connectivity over successive generations of species. It works particularly well for habitats that are well-defined and patchy. However, if the area of interest is likely to be very small (roughly the distance required to colonise habitat within one generation of a target species) then Condatis is unlikely to produce results that will be meaningful. If however you are looking for a quick and easy to use application to look at directional connectivity over a landscape, pick out the most effective sites for habitat creation, test climate change resilience or run a number of directly comparable colonisation scenarios then we would recommend trying Condatis.
A range of the different analyses our current users have undertaken using Condatis are illustrated on our case studies page